The most important feature of this section is the risk button, which is displayed according to the severity of the issues: green ( "Status" ), orange ( "Warning" ) and red ( "Critical" ).


The green button appears when you have had issues and they have been resolved.
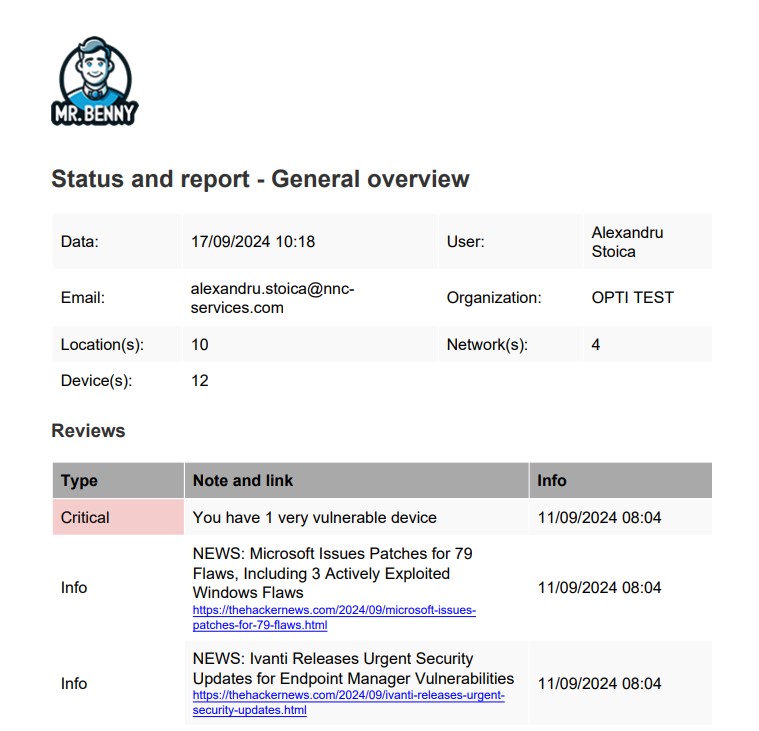
You can get some very nice reports (customizable) about the situation of your organization:
General Overview
Issue(s) overview
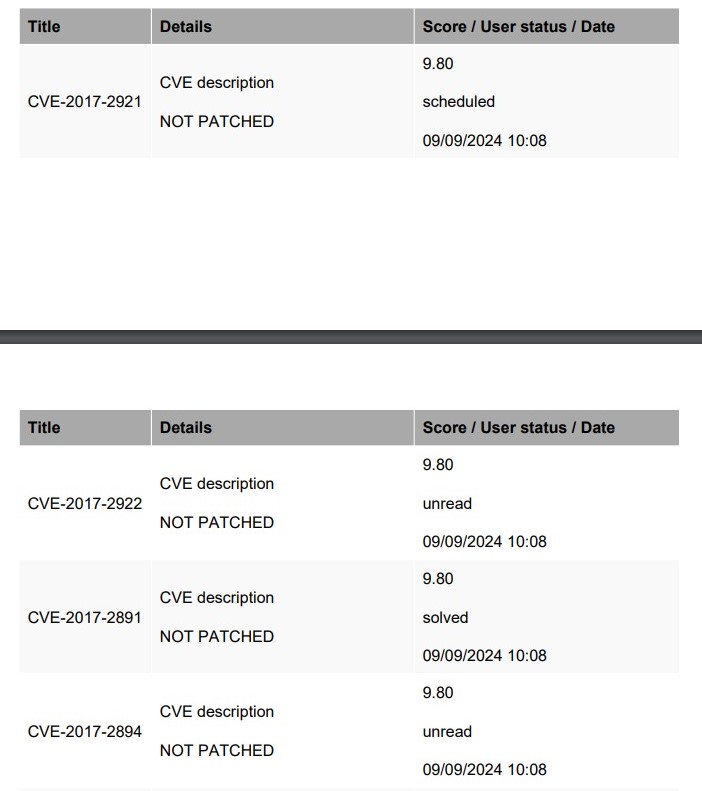
Risk Assessments
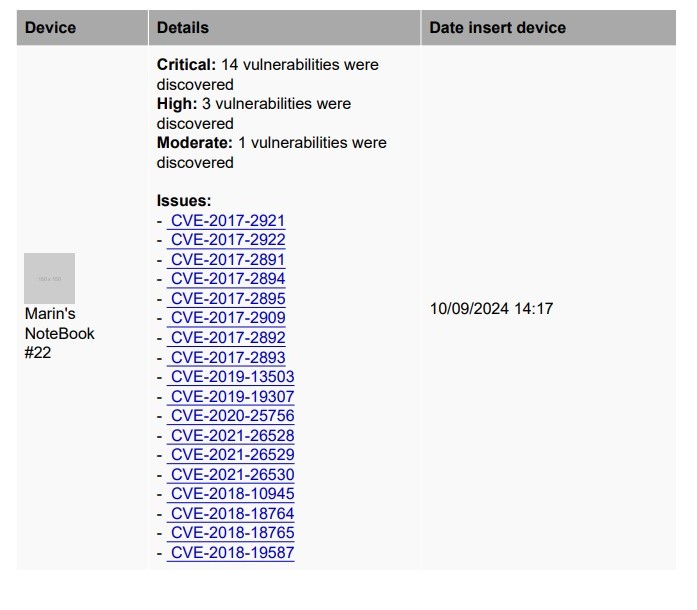
Device(s) overview
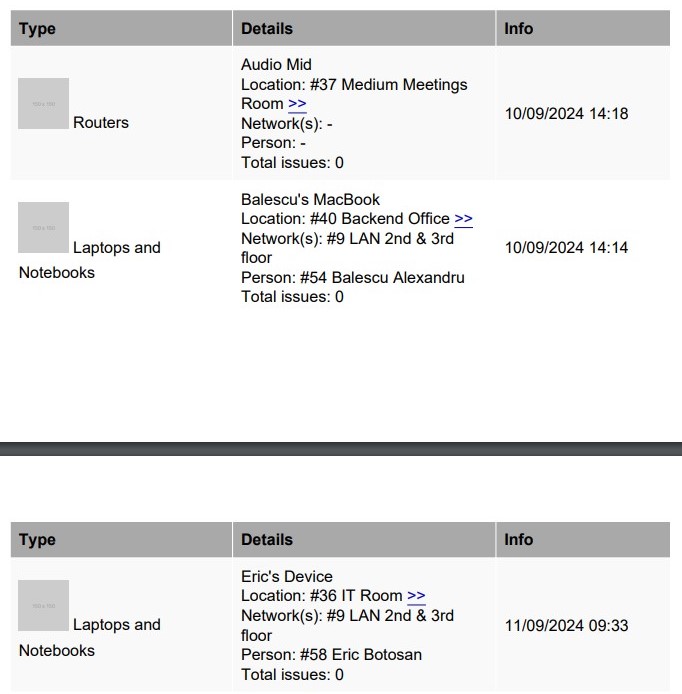
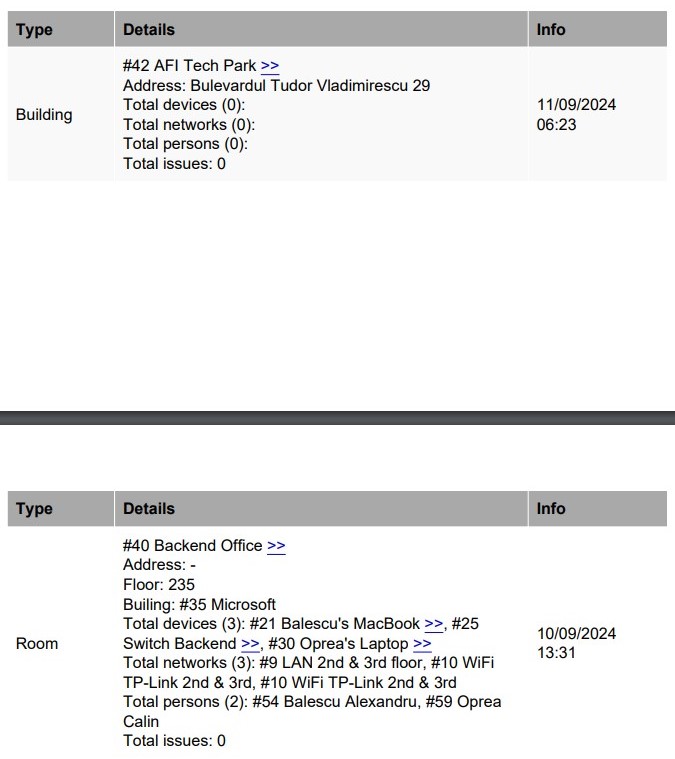
Location(s) overview
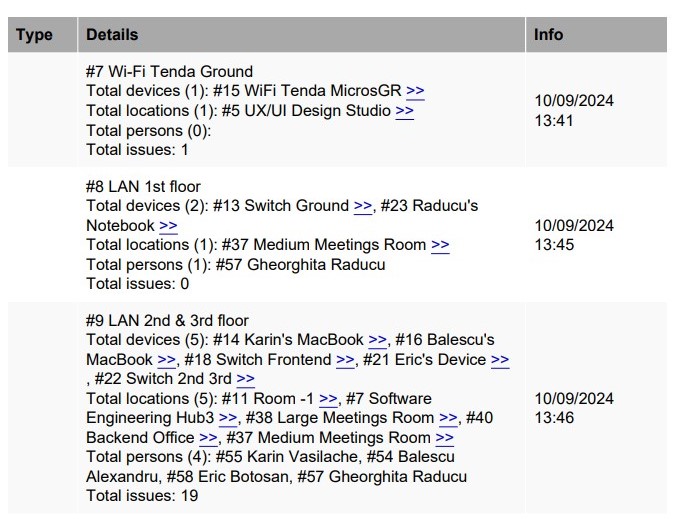
Network(s) overview
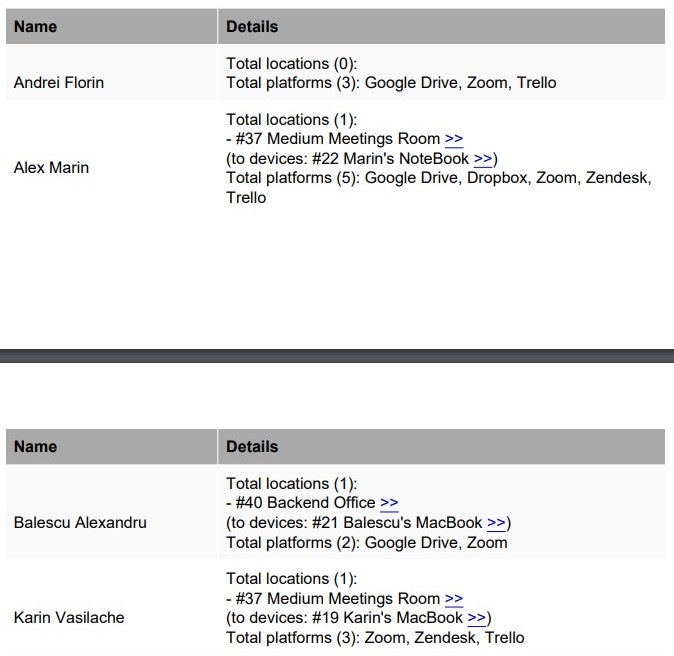
Employee(s) overview
Video Guide